
















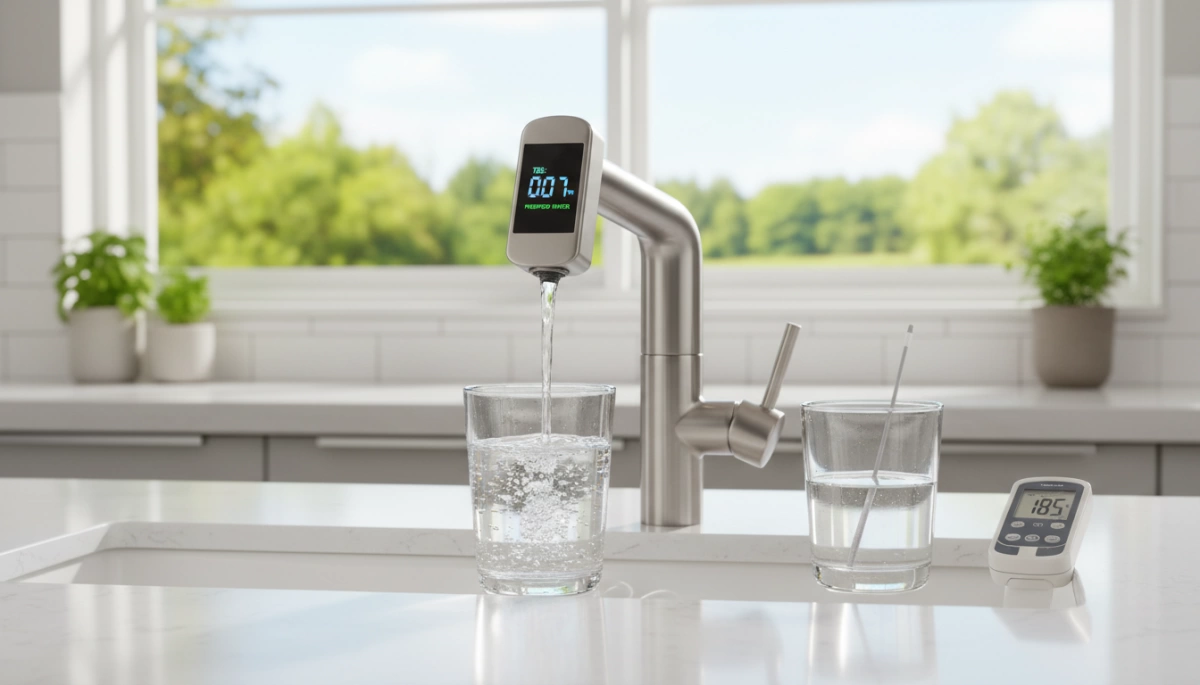
You’ve likely seen the sleek digital numbers glowing on the latest smart faucets…
But can you actually trust that readout?
As a manufacturer of precision filtration systems, I know that Water Quality Monitoring Accuracy isn’t just about slapping a sensor on a pipe—it’s about complex engineering.
The truth is, there is a massive difference between a marketing gimmick and a reliable safety tool.
In this post, we’re going to break down exactly how TDS Faucet Displays function, the hidden variables that can skew your data, and whether that digital number really guarantees purity.
Let’s get to the truth.
Decoding the Display: How Inline TDS Sensors Actually Work
Ever glance at the number on your smart faucet and wonder, “Is this thing actually guessing, or is it precise?” It’s a valid concern. As manufacturers, we know that trust is built on transparency. Let’s strip away the marketing fluff and look at the engineering that powers real-time water conductivity sensors.
The Physics of Conductivity: Ions and Electrical Currents
We aren’t counting individual dust particles in the water. That would require a lab microscope. Instead, digital water purity monitors rely on simple physics: electrical conductivity.
- Pure Water: Acts as an insulator. It resists electricity.
- Contaminated Water: Minerals, salts, and metals (ions) conduct electricity.
Our sensors send a low-voltage electrical pulse between two titanium or gold-plated probes. The easier the current flows, the higher the concentration of dissolved solids. We measure the resistance and mathematically convert that “shock” into the number you see.
Inline vs. Handheld: Dynamic Sensors vs. Static Meters
Why does your handheld pen sometimes show a slightly different number than your faucet? It comes down to flow dynamics.
- Handheld Meters (Static): You dip the pen into a still glass of water. The sample is stagnant, making it easy to get a locked reading.
- Inline Sensors (Dynamic): Our faucet sensors measure a “rushing river.” Water flows past the probe at high pressure and variable speeds.
To ensure TDS monitoring accuracy RO, we engineer our firmware to average thousands of readings per second, filtering out the “noise” caused by water turbulence to give you a stable, reliable figure.
The Traffic Light Logic: Converting PPM Data to Visual Cues
Raw electrical data is useless to the average user. We translate that conductivity into PPM (Parts Per Million) and simplify it further with color-coded indicators for instant feedback.
Here is the standard logic we program into the display:
- Blue/Green (0–50 PPM): Excellent. The Reverse Osmosis membrane is functioning at peak efficiency.
- Yellow/Orange (51–100 PPM): Fair. The water is safe, but filter life is degrading, or the incoming water source is extremely heavy in minerals.
- Red (>100 PPM): Warning. High conductivity detected. This usually signals a need for immediate maintenance or filter replacement.
Analyzing Accuracy: Factors That Influence Your Faucet’s Reading
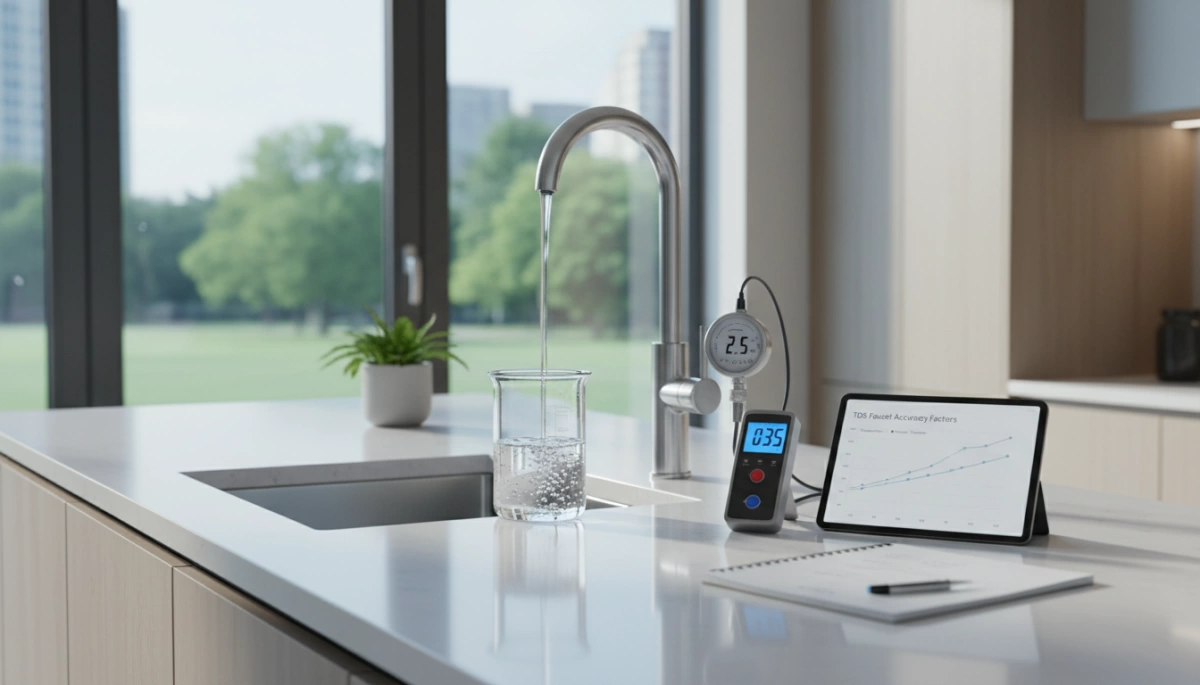
When you look at the smart display on your DripLife faucet, you are seeing a snapshot of water quality in real-time. However, getting that number isn’t just about the filter; it’s about physics. Several environmental and mechanical factors can cause slight variations in the numbers you see. Understanding these variables ensures you know exactly how your system is performing without unnecessary worry.
Flow Rate Dynamics: How Pressure Alters Results
Water pressure isn’t static. In our high-capacity 600 GPD and 800 GPD systems, water moves quickly—filling a cup in about 6 seconds. Real-time water conductivity sensors rely on a steady stream to measure the electrical resistance of the water.
- Pressure Surges: Sudden changes in household water pressure can momentarily disrupt the flow across the sensor.
- Stabilization Time: You might notice the number fluctuate for the first second as the flow stabilizes. This is normal behavior for high-speed, tankless systems.
Temperature Fluctuations: The Need for ATC
Temperature is the silent disruptor of PPM (Parts Per Million) accuracy. Warmer water is naturally more conductive, which means electricity passes through it easier. Without correction, warm water would show a falsely high TDS reading, making you think your water is dirty when it isn’t.
- Conductivity Shift: A 1°C increase in temperature can increase conductivity readings by about 2%.
- The Fix: Quality systems utilize temperature compensation in TDS sensors (ATC). This feature automatically calculates the temperature difference and adjusts the displayed number to a standard baseline (usually 25°C), ensuring consistent data regardless of the season.
Air Bubbles & Turbulence
If you have just installed a new DripLife system or replaced a cartridge using our twist-and-pull design, you might see erratic numbers initially. This is often due to micro-bubbles.
- Interference: Tiny air bubbles can stick to the sensor probes, insulating them from the water.
- The Result: The sensor reads “air” instead of water, causing the numbers to jump wildly.
- Solution: This resolves itself once the system is fully flushed and the air is purged. Understanding these physical quirks is part of knowing why water filtration is crucial for consistent home health.
The Creep Phenomenon
You might notice that the TDS reading is slightly higher the moment you turn on the tap after it has been off all night. This is known as “TDS Creep.”
- Ion Migration: When an RO system sits idle, the natural osmotic pressure can push a small amount of dissolved solids from the waste side back to the clean side of the membrane.
- Tankless Advantage: While our tankless design minimizes this compared to tank-based systems (which store that “crept” water), a brief spike at startup is standard physics.
- Self-Correction: Once the flow starts, the reverse osmosis (RO) membrane efficiency kicks in immediately, flushing the creep water and dropping the reading back to its optimal low level within seconds.
The Reality Check: What TDS Displays Do (and Don’t) Tell You
The Accuracy vs. Safety Distinction
When we discuss Water Quality Monitoring Accuracy in TDS Faucet Displays, it is vital to understand the difference between a purity reading and a complete safety audit. A digital water purity monitor essentially measures electrical conductivity to estimate the Total Dissolved Solids (TDS) in your water. While this is the industry standard for verifying that our Reverse Osmosis (RO) membranes are functioning correctly, the number on your smart faucet is a performance metric, not a biological scan. It confirms the system is doing its job, but it requires context to interpret correctly.
What It Measures: Minerals, Salts, and Metals
The sensors in our smart faucets are tuned to detect conductive ions. If it carries an electrical charge, the display will catch it. This provides excellent visibility into the reduction of:
- Heavy Metals: Dangerous elements like lead, arsenic, and mercury.
- Dissolved Salts: Compounds such as fluoride and nitrates.
- Minerals: Common hard water elements like calcium and magnesium.
If you live in an area with high mineral content, understanding hard water modification helps explain why your feed water input numbers might be high. The display’s primary job is to show you the dissolved solids reduction rate, proving that the filter is stripping away the vast majority of these conductive impurities.
What It Misses: Non-Conductive Contaminants
We believe in total transparency regarding our technology. Because TDS sensors rely on conductivity, they have inherent blind spots for contaminants that do not impact electrical current.
- Pesticides & Herbicides: Many agricultural run-off chemicals are non-conductive and won’t spike a TDS reading.
- Microorganisms: While our 0.0001-micron RO membrane physically blocks bacteria and viruses, these pathogens do not register on a conductivity-based meter.
- Volatile Organic Compounds (VOCs): Certain synthetic chemicals may pass through a conductivity test unnoticed.
However, this is where the physical engineering of the DripLife system steps in. Even though the PPM (Parts Per Million) accuracy of the display focuses on solids, our 7-stage filtration process is actively removing these non-conductive threats. The display confirms the membrane is intact; the membrane’s rating guarantees the physical filtration.
Why a Non-Zero Number is Okay: Balancing Taste and Health
A common misconception is that a TDS reading must be “0” for water to be safe. In reality, a reading of 0 is typically reserved for distilled water, which can taste flat and acidic. If your incoming water supply is 400 PPM and your DripLife faucet displays 20 PPM, you are achieving a 95% rejection rate. This is excellent performance. A slightly non-zero number often indicates trace minerals that improve water taste without exceeding heavy metal detection limits. We aim for water that is safe and refreshing, not sterile and flavorless.
Driplife’s Engineering Edge: Ensuring Precision at the Tap
At Driplife, we believe that trust is built on transparency. We don’t just claim our Reverse Osmosis (RO) membrane efficiency is top-tier; we engineer our systems to prove it to you every time you turn on the tap. Our approach to water quality monitoring accuracy in TDS faucet displays goes beyond simple numbers. We integrate lab-grade sensing technology directly into your daily hydration routine, ensuring the “Pure, Health, Life” promise is met with every glass.
Dual-Probe Technology
Standard systems often only show you the final output, leaving you guessing about the incoming water quality. We utilize dual-probe technology to provide a complete picture.
- Input Monitoring: One sensor analyzes the feed water entering the system.
- Output Verification: A second sensor measures the purified water post-filtration.
This setup allows for a real-time calculation of the dissolved solids reduction rate. By constantly comparing these two data points, our smart faucets confirm that the 0.0001-micron RO membrane is effectively removing contaminants like PFAS and heavy metals. Whether you are using our under-sink units or our versatile Countertop 3-in-1 RO cold and hot water purifier, this comparative data gives you immediate peace of mind.
Strategic Probe Positioning
Accuracy is often lost due to poor sensor placement. In many generic systems, air bubbles or water turbulence can cause erratic readings. We tackle this with inline TDS probe calibration positioned in the most stable sections of the flow path.
- Turbulence Reduction: Sensors are placed where water flow is laminar, preventing pressure spikes from skewing the data.
- Interference Shielding: Our tankless design minimizes the “creep” effect, ensuring the sensor reads fresh water rather than stagnant water that has accumulated ions.
Material Integrity and Calibration
A digital water purity monitor is only as good as the materials it is built from. We refuse to cut corners with cheap sensors that degrade over time.
- Corrosion Resistance: We use high-quality, lead-free sensor components designed to resist oxidation. This ensures that the smart faucet LED indicators remain accurate over the lifespan of the system, even with high-TDS feed water.
- Factory Benchmarking: Before a Driplife system reaches your doorstep, the sensors undergo rigorous testing against laboratory standards. We calibrate our real-time water conductivity sensors to match professional benchmarks, ensuring that the number you see on your faucet is a precise reflection of your water’s purity.
Maintenance: Keeping Your Smart Faucet Accurate
We design our tankless systems to be as hands-off as possible, but like any precision instrument, a little care goes a long way. To ensure your smart faucet LED indicators continue providing trustworthy data, basic maintenance is non-negotiable. The accuracy of the digital water purity monitor relies heavily on the cleanliness of the sensors and the condition of the filtration media.
Sensor Cleaning: How to Flush the System for Better Readings
Over time, mineral scale or biofilm can accumulate on the real-time water conductivity sensors inside the unit, potentially insulating the probes and causing lower-than-actual readings. Because our systems are tankless, maintenance flushing is straightforward.
- Daily Flush: Run the faucet for 15–30 seconds every morning. This clears any standing water where TDS creep might have occurred and ensures the sensor is reading fresh, flowing water.
- Post-Vacation Flush: If the system has sat idle for a week, run the water for 2–3 minutes. This helps reset the inline TDS probe calibration baseline by ensuring the internal waterways are completely rinsed of stagnant ions.
Filter Discipline: How Clogged Filters Indirectly Skew Sensor Data
A common misconception is that a rising TDS number means the sensor is broken. In reality, it usually means the filter lifespan monitoring algorithms are trying to tell you something. As filters clog, flow pressure changes, and the Reverse Osmosis (RO) membrane efficiency can drop if pre-filters aren’t catching sediment effectively.
If you neglect the 6–12 month schedule for PCC/PAC filters or the 24-month timeline for the RO membrane, the system struggles to reject solids. The sensor is accurately reporting that your water quality is degrading. For those dealing with particularly challenging input water, understanding solutions for managing high TDS source water is critical to preserving both your membrane life and sensor accuracy.
When to Recalibrate: Signs the Sensor Needs Attention
Since DripLife faucets are factory-calibrated against laboratory benchmarks, manual recalibration is rarely needed. However, you should watch for specific signs that the digital water purity monitor might need a system reset or a check-up:
- Erratic Jumps: If the display swings from 10 to 200 PPM in seconds without a change in water source.
- Frozen Display: The number doesn’t change even after running water for several minutes.
- Zero Readings: Consistently showing “0” on input water (feed water) suggests a connection issue, as raw tap water rarely has zero TDS.
maintaining the integrity of your filtration system ensures that the dissolved solids reduction rate displayed on your tap is a true reflection of the water you are drinking.
FAQ: Common Questions About Water Quality Monitoring Accuracy
Why is my faucet TDS reading different from my handheld meter?
It is completely normal to see a slight variance between your smart faucet LED indicators and a handheld stick. Handheld meters test static water in a cup, which means the reading can be influenced by residue in the glass, air bubbles, or even dust. In contrast, our real-time water conductivity sensors measure moving water directly inside the flow path. As long as both numbers are low and within a close range, your water filtration system reliability is intact.
Does a low TDS number guarantee the water is safe to drink?
A low TDS reading is a great sign, but it isn’t the whole story. TDS specifically measures conductive dissolved solids like salts and heavy metals. It does not detect non-conductive contaminants like certain pesticides or bacteria. However, because our systems use a 0.0001-micron RO membrane, those contaminants are removed alongside the dissolved solids. To understand more about what different methods remove, it helps to know the distinction between purified water vs. filtered water.
How often do digital TDS sensors need to be replaced?
Unlike the filtration cartridges, the integrated sensors in our faucets are designed to last the lifespan of the unit. You generally do not need to worry about replacing the sensor itself. The focus should remain on maintaining Reverse Osmosis (RO) membrane efficiency by changing your filters on schedule, which keeps the sensors clean and functioning correctly.
Can temperature changes really throw off the accuracy that much?
Yes, temperature plays a massive role in PPM (Parts Per Million) accuracy. Water conductivity naturally increases as the water gets warmer. Without proper temperature compensation in TDS sensors, a reading could spike just because the weather is hot, giving you a false alarm. Our systems are engineered to account for these fluctuations, ensuring you get data based on purity, not just heat.